Research: Aging Bioinformatics
THE GREAT MYSTERY
Aging is a great mystery, why do we age, how does it work, and what can we do about it? Why is it that a worm can have a single gene mutated and it lives twice as long; why didn’t evolution evolve that in the first place? (Possible answer here) Why is it that closely related animals can have such different lifespans like between the three year limit for lab mice vs decades limit of naked mole rats, or even just between small and large dog breeds? Why is it that animals in a protective niches tend to live longer? And the list goes on, as you can see there are many fascinating questions, and here we’re going to try to shed some light on the subject.
The experiment
IPSCs are induced pluripotent stem cells that are basically the same as the type of cells in an embryo that can turn into any other kind of cell in the body, and their biological age is basically zero. Then there are global aging genes (GAG), genes discovered in a paper by checking many aging tissues and see what genes are either up or down regulated in common across the different tissues.
Basically since IPSCs can be created from any kind of cell in human body by overexpressing OSK genes, cells need to have a way of reversing all these global aging genes. Therefore there should be some interaction pathway from OSK genes to reverse the direction of each global aging gene. If we look at where all these interaction pathways overlap using the shortest path, we should find common regulatory genes for global aging genes. These genes when up or down regulated could reverse aging like an IPSC without the dedifferentiation.
Also as a final control, we’ll run the experiment with random genes and see how the results compare.
The data
The regulatory gene paths are downloaded from https://grand.networkmedicine.org/tissues/ and I used every single tissue type (along with a fibroblast cell line): Adipose Subcutaneous, Adipose Visceral, Adrenal Gland, Artery Aorta, Artery Coronary, Artery Tibial, Brain Basal Ganglia, Brain Cerebellum, Brain Other, Breast, Colon Sigmoid, Colon Transverse, Esophagus Mucosa, Esophagus Muscularis, Gastroesophageal Junction, Heart Atrial Appendage, Heart Left Ventricle, Intestine Terminal Ileum, Kidney Cortex, Liver, Lung, Minor Salivary Gland, Ovary, Pancreas, Pituitary, Prostate, Skeletal Muscle, Skin, Spleen, Stomach, Testis, Thyroid, Tibial Nerve, Uterus, Vagina, Whole Blood, fibroblastCellLine. Also I used the PANDA version and to download it under the “Network” column you click “Adj”.
The way I converted between ENSG ids and actual gene names I used https://ftp.ensembl.org/pub/release-74/gtf/homo_sapiens/. It uses an older genome assembly since that’s what the regulatory gene paths uses. Potentially could get better results if it all used a newer one. Since when I initially discovered the difference between how many genes mapped between assembly 28 to the gene regulatory pathways using assembly 27, there was like 25% that were not found.
Finally I used the global aging gene data from this paper https://elifesciences.org/articles/62293 and the direct link to the data is here https://figshare.com/articles/dataset/tms_gene_data_rv1/12827615?file=27857814.
The code
The code can be found here: https://github.com/luojxxx/Aging-Bioinformatics. The dependencies are all at the top. The specific ipython notebook is bioinfo_PANDA.ipynb
The code itself is relatively simple. It loads and cleans all the data. The only part that’s kind of interesting is how the regulatory networks are turned into something that works with the code to find the shortest path.
So the regulatory pathways comes to you as a table between the regulatory genes and it’s effect on all the other genes in the cell. Large numbers represent a large effect, small numbers a small effect; positive numbers represent a upregulating effect, negative numbers represent a downregulating effect. But how do we find the shortest path when you need the fewest nodes with the largest weights while some are upregulating and downregulating.
Basically you take the inverse of the numbers, so that the largest effects become the smallest number; this way you’re trying to get the fewest nodes with the smallest weights. Finally you take the absolute value of the weights, so that it’s just finding the strongest interactions whether it’s up or down regulating. Now you have a simple but properly represented graph you can plug into a shortest path algorithm.
Finally the control takes the regulatory pathway and samples randomly from the ~30,000 genes. There’s the same number of random genes as OSK genes as an origin, and the same number of random genes as the global aging genes as an endpoint, so that it’s comparable. The control is run three times with different random genes.
If you want to run it yourself, just put the ipython notebook, ENSG dataset, and GAG dataset in the same folder, and then create a ‘data’ folder to store the Grand datasets.
The results
You can see in the ipython notebook the results across all 36 tissue types from OSK to global aging genes and below that the control random genes to random genes. The relevant genes to reversing the global aging genes for these cells it greatly enriched, in other words they stand out a lot. I’ll just go over the top five genes and let you look at the rest if you’re interested:
ENSG00000120738: EGR1 is a transcription factor. “The products of target genes it activates are required for differentiation and mitogenesis. Studies suggest this is a tumor suppressor gene.” This is interesting because it seems like it functions as a tumor suppressor while the cell multiplies and differentiates.
ENSG00000115816: CEBPZ is an enhancer binding protein with not much known about it’s function, but clearly it’s important.
ENSG00000085276: MECOM is a gene with a conserved developmental role in the embryo (it dies without it) and it is also a proto-ocogene. This was kind of a surprising results, but it still makes sense. Technically looking at the shortest pathways while combining up/down regulation between OSK genes and global aging genes is a two way street. It’s not just how to reverse aging, but also how OSK genes cause these global aging genes to occur. This also makes sense when we consider that as the embryo develops, it’s Horvath clock age increases dramatically in line with MECOM’s expression in embryogenesis. While once a person reaches adulthood, it’s in minimal amounts.
ENSG00000189079: ARID2 is a significant tumor suppressor.
ENSG00000150907: FOXO1 is a transcription factor that plays important roles in the regulation of gluconeogenesis and glycogenolysis by insulin signalling. This may help explain why things like calorie restriction leads to longer lifespans.
If you look at individual tissue types you can see different results pop up at the top.
Overall, this is a very interesting result, genes related to the aging process are enriched/overlapped hundreds of times beyond the lowest ones that are only overlapped once, and this doesn’t even include the other genes in the ~30,000 total gene set that aren’t even overlapped once.
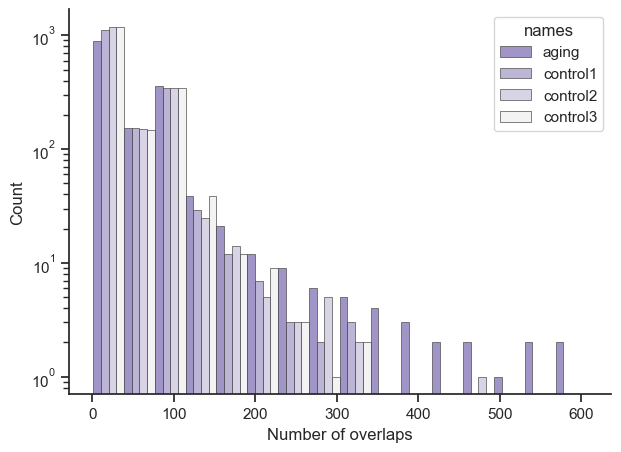
The top results from the control random genes is half as overlapped as the top aging results with a sharper fall off, and the genes from the control either don’t overlap with the aging ones or are less represented. A histogram and a table compares across the aging and control sets below:
Just so it’s clearer, let’s say you had a result of {‘ENSG1’: 10, ‘ENSG2’: 10, ‘ENSG3’: 50}. The X axis would show a bar at number of overlaps 10 with a count of 2, and another bar at number of overlaps 50 with count 1. Also the bars position is roughly accurate, due to putting multiple bars for aging, control1, control2, and control3 next to each other; so aging’s largest value is 606, it’s just that the bar is shoved to the left by the other bars.
This table compares between aging and controls datasets. The first number shows how much do the genes intersect with each other (how many of the same genes show up in both datasets). The second number shows the total overlaps from the endpoint dataset for the intersected genes. The third number is simply the average. So for example if the result was Origin: {‘A’: 10, ‘B’:20, ‘C’: 15} Endpoint: {‘A’: 5, ‘B’: 1} then the result would be 2 // 6 // 3. The cells where the dataset is compared with itself gives you an idea of the baseline.
These aging genes should be examined experimentally to determine how it works in the context of aging, and if they help reverse or stop aging in the cell either in comparison to the global aging genes or in comparison to epigenetic clocks like the Horvath clock. And one additional thing to try before testing it experimentally is run it through a simulation of the cell to figure out which genes or combinations of genes would likely lead to the greatest effect.
What’s interesting is that we’ve sequenced the human genome, catalogued every RNA and protein in the cell, the answer to why aging occurs and potentially how to reverse or stop it is sitting right in front of our faces. It’s tied up in a cryptic puzzle, but hopefully these results and the research launched off it can help finally unravel this great mystery.
RAW Output
For the sake of convenience, I’ve copied out the part that goes over all 36 tissue types + 1 cell line, and a control set. You can just google search the ENSG ids to see what the gene does.
OSK to global aging gene set
Size: 1502
Average: 52.745672436751
Median: 21.0
control 1 random to random set
Size: 1666
Average: 39.90876350540216
Median: 16.0
Update (12/21/24)
Out of curiosity I re-ran the code on miRNA regulatory networks and also found some interesting results. The code and results are under bioinfo_PUMA.ipynb. Obviously the results are different. But in terms of code differences, the columns in PUMA are gene names whereas columns in PANDA were gene IDs, so that had to be compensated for.
The results
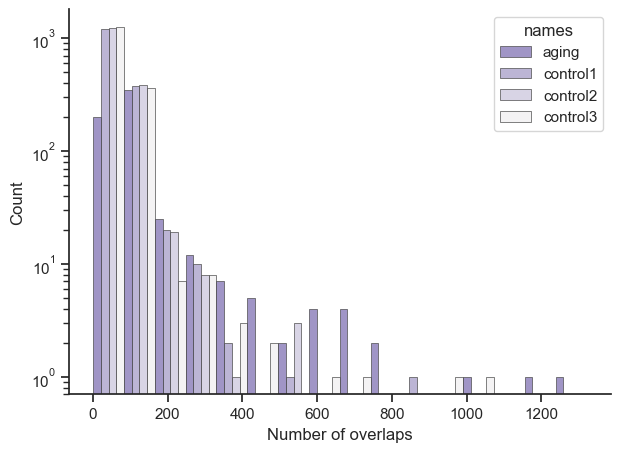
So there are certain miRNAs heavily enriched in this counting overlaps process, but unfortunately very little is known about these miRNAs. So the resulting top miRNAs don’t tell us much upfront. But it would be interesting to overexpress or knockdown the top miRNAs into an aged cell, and see what it would do to the global aging genes. As well as combining both the results from the PANDA datasets with the results from the PUMA dataset.
Just so it’s clearer, let’s say you had a result of {‘ENSG1’: 10, ‘ENSG2’: 10, ‘ENSG3’: 50}. The X axis would show a bar at number of overlaps 10 with a count of 2, and another bar at number of overlaps 50 with count 1. Also the bars position is roughly accurate, due to putting multiple bars for aging, control1, control2, and control3 next to each other; so aging’s largest value is 606, it’s just that the bar is shoved to the left by the other bars.
This table compares between aging and controls datasets. The first number shows how much do the genes intersect with each other (how many of the same genes show up in both datasets). The second number shows the total overlaps from the endpoint dataset for the intersected genes. The third number is simply the average. So for example if the result was Origin: {‘A’: 10, ‘B’:20, ‘C’: 15} Endpoint: {‘A’: 5, ‘B’: 1} then the result would be 2 // 6 // 3. The cells where the dataset is compared with itself gives you an idea of the baseline.
OSK to global aging gene set
Size: 608
Average: 109.41447368421052
Median: 111.0
control 1 random to random set
Size: 1630
Average: 42.22085889570552
Median: 14.0


