Research: Aging Network Bioinformatics

The experiment
Previously I ran an experiment to find central genes from the OSK genes used to create induced pluripotent stem cells to the global aging genes (genes discovered in a paper by checking many aging tissues and seeing what genes are either up or down regulated in common across the different tissues). Now my question is, what are the genes central to the global aging genes? Does it link to the aging machinery that governs the cell?
So what we’ll do to find the central genes is compare the global aging genes to themselves in a pairwise fashion. To be more precise, it’ll be like having two lists of all the global aging genes and we’ll compare every pair between the two lists. When we compare the pairs, we’ll find the strongest path of interactions through the gene regulatory network. Then we aggregate these strongest paths by counting the nodes that appear over and over again.
The experiment is run on the global aging genes while the control is run on randomly selected genes from the regulatory network.
The data
The network is downloaded from https://downloads.thebiogrid.org/File/BioGRID/Release-Archive/BIOGRID-5.0.255/BIOGRID-ORGANISM-5.0.255.tab3.zip it uses the mus musculus file for lab mice. Note there are genes in biogrid that aren’t found in gene_info like 6622 is only found for humans.
The way I converted between Entrez ids and actual gene names I used https://www.ncbi.nlm.nih.gov/books/NBK3840/?utm_source=chatgpt.com#:~:text=You%20can%20therefore%20convert%20any%20GeneID%20into%20its%20current%20names%20by%20using%20the%20definitions%20provided%20in%20the%20file%20available%20as%20https%3A//ftp.ncbi.nlm.nih.gov/gene/DATA/gene_info.gz Note there are symbols collisions, the synonyms for a gene can be the same for multiple genes.
I used the mouse global aging gene (GAG) data from this paper https://elifesciences.org/articles/62293 and the direct link to the data is here https://figshare.com/articles/dataset/tms_gene_data_rv1/12827615?file=27857814.
Finally I used the GenAge dataset that is a dataset of genes related to aging https://genomics.senescence.info/download.html.
The code
The code can be found here: https://github.com/luojxxx/Aging-machinery. The dependencies are all at the top.
The code itself is relatively simple. It loads and cleans all the data. Importing the biogrid network as an undirected graph and finding the shortest path between the target genes.
The experiment compares the GAG list to itself. While the control takes the regulatory pathway and samples randomly from the 19299 genes in the biogrid dataset. There’s the same number of random genes as the global aging genes (324 genes), so that it’s comparable.
If you want to run it yourself, just put the ipython notebook, gene_info dataset, biogrid dataset, GAG dataset, and GenAge dataset in the same folder.
The results
The results are promising. Although the experimental results are enriched less so than the control results, you can tell by the path length histograms it’s just because the paths are much more direct in the experimental group than the control group. The overlapping genes between the experimental and control group does show that the enrichment favors the control group, but that it just because of the point made earlier with shorter paths. There’s also a full third of the experimental results are not overlapping at all with the random control group which suggest better separation between experimental and random results. Overall, this could point to a central mechanism to aging that merits additional research, particularly since the endpoints are so spread out through out the cell, yet you still see a closely connected network compared to random controls.
Experimental Results
Size: 1758
Average: 76.65642775881683
Median: 7.0
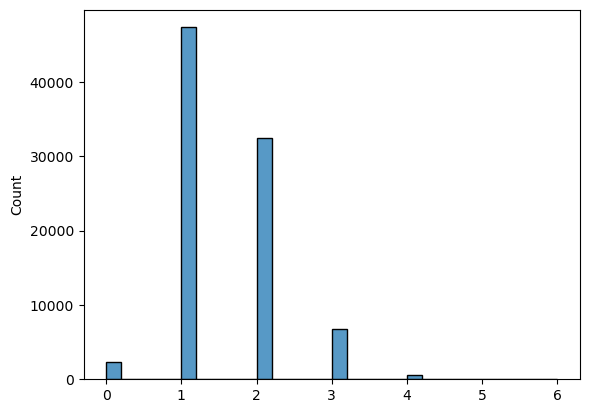
Histogram of the path lengths for experimental counts
Control Results
Size: 3177
Average: 93.68649669499528
Median: 10
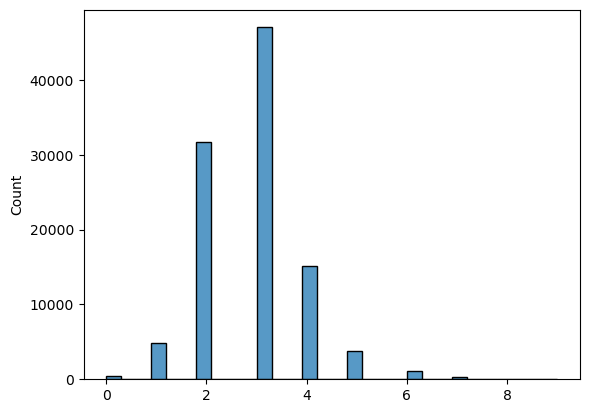
Histogram of the path lengths for control counts
Overlapping genes with the difference of their values
Size: 1109
Average: -62.66275924256087
Median: -4
Genes unique to the aging counts
Size: 649 Average: 18.476117103235747 Median: 4
After thinking about it, I added one final metric to sift through the list of potential aging genes: pubmed search results. Basically I search for the gene name along with the keyword “aging” and count how many search results are returned. This number is divided by the maximum value found from across the whole dataset to return a percentile. The same is done for the overlaps, the overlap count for a particular gene is divided by the maximum value found across the whole dataset. The two percentiles are added together, each with a max value of 1, together with a max value of 2, and the results are sorted based on the combined hybrid value. The results are shown below along with a boolean that shows whether the gene is found in the GenAge dataset of identified genes related to aging. As you can see many of the top results are found in the GenAge dataset, which highlights how this enriching process works and how the yet unverified genes provides a shortlist for further research to further complete the GenAge dataset.
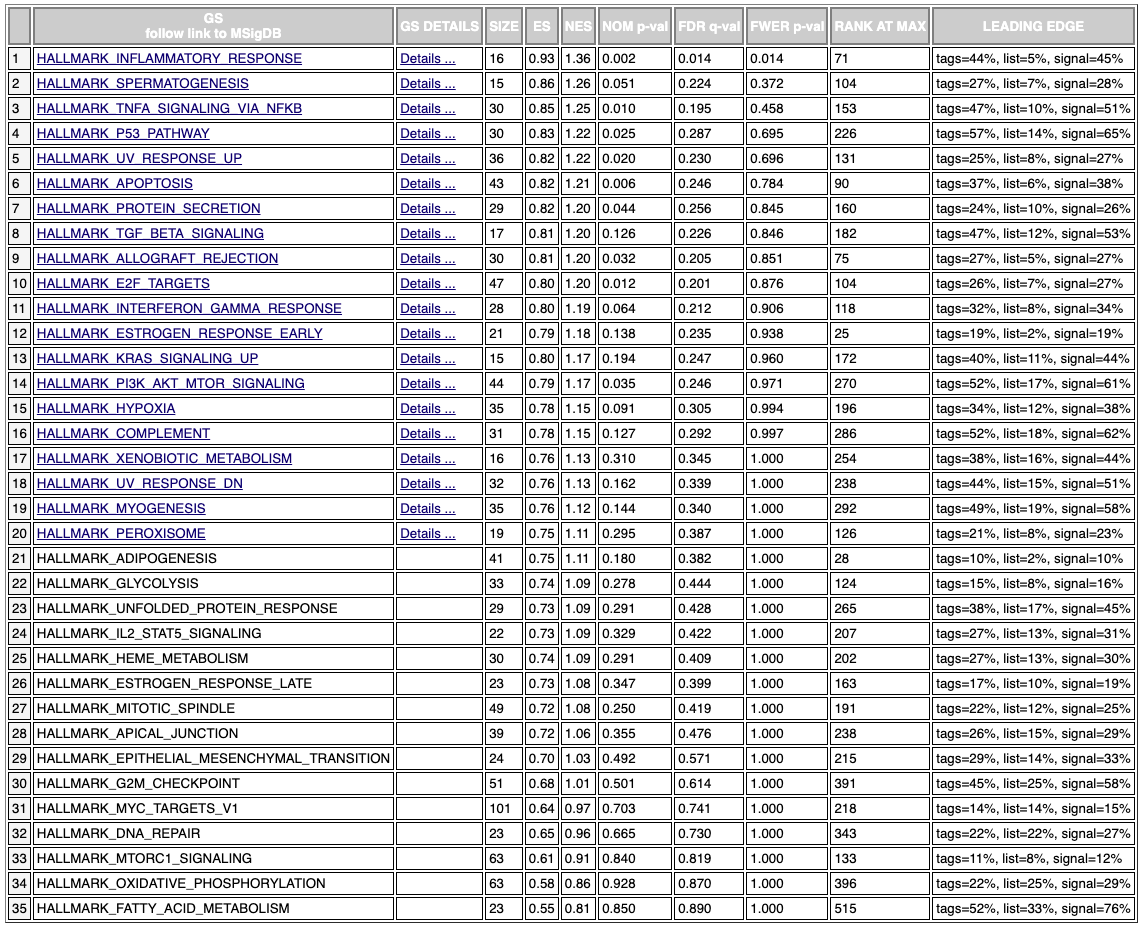
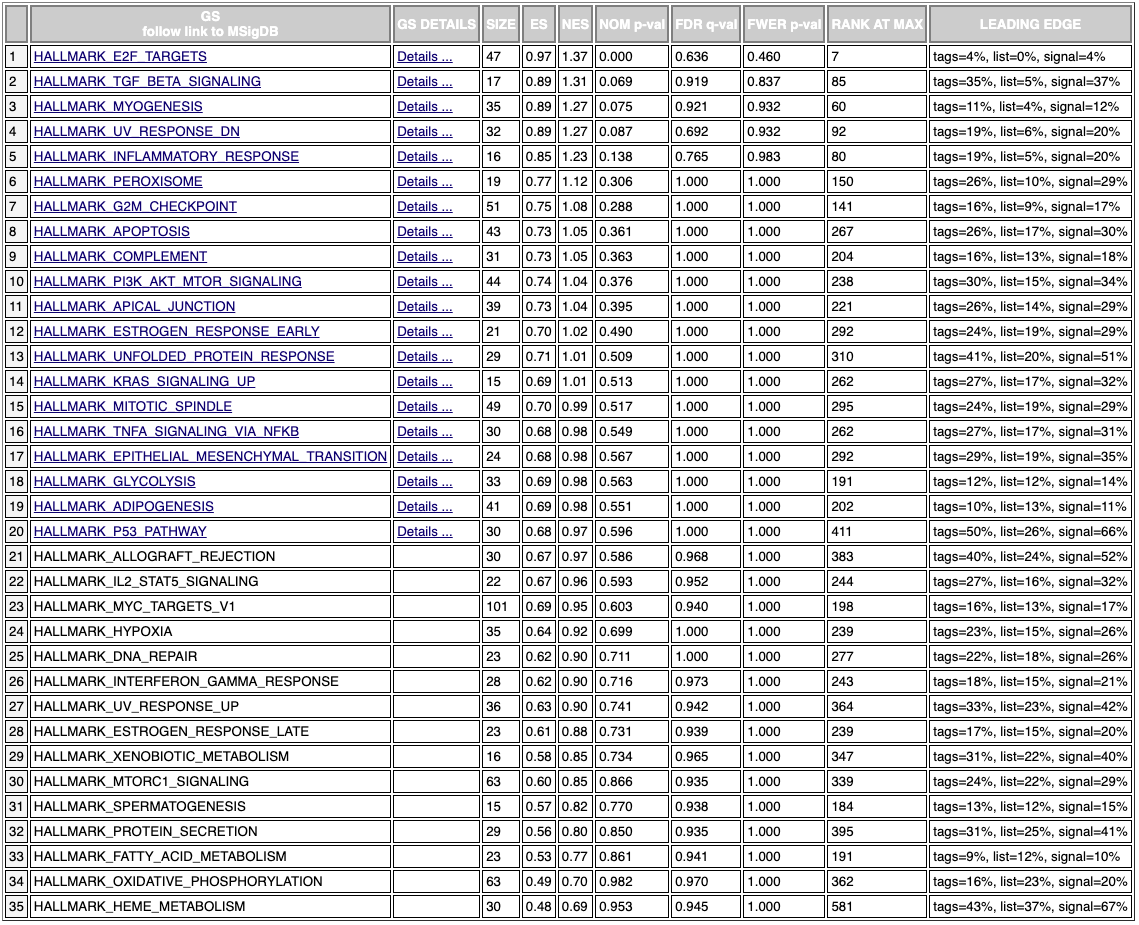
Finally there’s the gene set enrichment analysis, which with just the enriched results (without the pubmed metric) produces mediocre results. The hybrid metric does show meaningful results. The inflammatory response is the top hit which is promising since it’s known inflammation drives aging.
Experimental-only GSEA
Hybrid metric GSEA