Research: Reversing Aging Bioinformatics

THE GREAT MYSTERY
Aging is a great mystery, why do we age, how does it work, and what can we do about it? Why is it that a worm can have a single gene mutated and it lives twice as long; why didn’t evolution evolve that in the first place? (Possible answer here) Why is it that closely related animals can have such different lifespans like between the three year limit for lab mice vs decades limit of naked mole rats, or even just between small and large dog breeds? Why is it that animals in a protective niches tend to live longer? And the list goes on, as you can see there are many fascinating questions, and here we’re going to try to shed some light on the subject.
The experiment
IPSCs are induced pluripotent stem cells that are basically the same as the type of cells in an embryo that can turn into any other kind of cell in the body, and their biological age is basically zero. Then there are global aging genes (GAG), genes discovered in a paper by checking many aging tissues and see what genes are either up or down regulated in common across the different tissues.
Basically since IPSCs can be created from any kind of cell in human body by overexpressing OSK genes, cells need to have a way of reversing all these global aging genes. Therefore there should be some interaction pathway from OSK genes to reverse the direction of each global aging gene. If we look at where all these interaction pathways overlap using the shortest path, we should find common regulatory genes for global aging genes. These genes when up or down regulated could reverse aging like an IPSC without the dedifferentiation.
Also as a final control, we’ll run the experiment with random genes and see how the results compare.
The data
The regulatory gene paths are downloaded from https://grand.networkmedicine.org/tissues/ using brain cerebellum, heart left ventricle, and skeletal muscle. Also I used the PANDA version and to download it under the “Network” column you click “Adj”.
The way I converted between ENSG ids and actual gene names I used https://ftp.ensembl.org/pub/release-74/gtf/homo_sapiens/. It uses an older genome assembly since that’s what the regulatory gene paths uses. Potentially could get better results if it all used a newer one. Since when I initially discovered the difference between how many genes mapped between assembly 28 to the gene regulatory pathways using assembly 27, there was like 25% that were not found.
Finally I used the human global aging gene data from this paper https://pmc.ncbi.nlm.nih.gov/articles/PMC7906136/ from their github https://github.com/maglab/AgeingSignatures2020_supplementary/tree/master.
The code
The code can be found here: https://github.com/luojxxx/Aging-Reversing-Aging. The dependencies are all at the top.
The code itself is relatively simple. It loads and cleans all the data. The only part that’s kind of interesting is how the regulatory networks are turned into something that works with the code to find the shortest path.
So the regulatory pathways comes to you as a table between the regulatory genes and it’s effect on all the other genes in the cell. Large numbers represent a large effect, small numbers a small effect; positive numbers represent a upregulating effect, negative numbers represent a downregulating effect. But how do we find the shortest path when you need the fewest nodes with the largest weights while some are upregulating and downregulating.
Basically you take the inverse of the numbers, so that the largest effects become the smallest number; this way you’re trying to get the fewest nodes with the smallest weights. Finally you split the network into two, one that is downregulating and one that is upregulating based on the sign of the weight and use the appropriate one depending on the desired result. Note this doesn’t take into account compositional paths with upregulating and downregulating intermediaries but I’ll take the simplicity of a first pass and we’ll see in the results how this simplification can hold. Overall, the idea is that it maps the journey from the OSK transcription factors through other transcription factors till it reaches the desired gene.
Finally the control takes the regulatory pathway and samples randomly from the ~30,000 genes. It uses the same OSK genes as an origin, and the same number of random genes as the global aging genes as an endpoint, so that it’s comparable.
If you want to run it yourself, just put the ipython notebook, ENSG dataset, and GAG dataset in the same folder, and then create a ‘data’ folder to store the Grand datasets.
The results
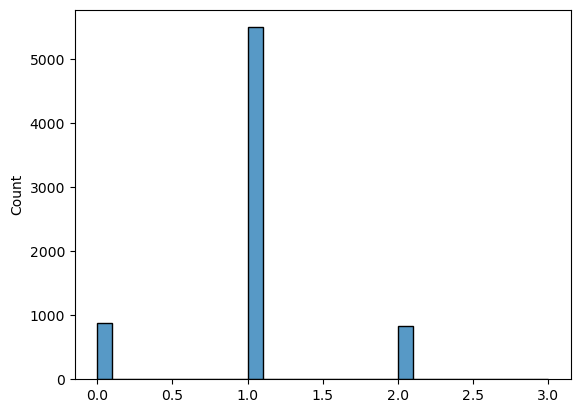
In general, the results were fairly weak. While there are enriched genes, it’s not beyond what you’d expect from in a random list of genes. Although the method to get the highest enriched values are long paths that are reused over and over again, which isn’t exactly what we want. So I also took a look at the path length and it’s mostly one, which means there’s one intermediate between OSK and the target gene (this also shows why our earlier simplification to avoid using a compositional up and down regulating paths somewhat works out because it’s mostly just one intermediate). Path length of one was the case for both experimental and random controls, which further strengthens their similarity. The no path counts are also similar. Although this may just be because the global aging genes are so diffuse and there isn’t a central mechanism for them all to funnel through that creates this result where the experimental and control counts are about equally enriched. Also there are a lot of overlaps, which isn’t terribly unexpected given there are only 645 transcription factors to act as an intermediate and you’re mapping out from OSK to thousands of aging genes. But when you take the difference in the counts of the overlapping genes much of it favors the random control set. Although arguably the enriched genes discovered in the experimental results is still doing what you want which is downregulating overexpressed genes from aging and upregulating underexpressed genes from aging.
Experimental Results
Size: 465
Average: 15.38494623655914
Median: 6

Histogram of the path lengths for experimental counts
Control Results
Size: 469
Average: 16.28358208955224
Median: 6
Histogram of the path lengths for control counts
Overlapping genes with the difference of their values
Size: 409
Average: -1.1418092909535453
Median: 0
Genes unique to the aging counts
Size: 56
Average: 1.6428571428571428
Median: 1.0